The crudest of models for Fannie Mae cumulative losses – (Fannie Mae Part III)

As explained in the “modelling post” there is very good reason why you cannot sensibly estimate prime mortgage losses. They are getting worse at an increasing rate.
I didn’t want to make it up. So I asked my readers for guidance. Nobody much helped me – but several people pointed to Jamie Dimon’s various statements on the subject. Those statements come down to Dimon’s broad guess that losses will triple.
We know the trends look awful.
But I have a model. Its crude – but in the face of radical uncertainty it is about the best I can do. So I will present it.
Below is a chart of the type that most thrill me as a bank analyst. It’s a cumulative loss chart as presented in Fannie’s last quarterly results.
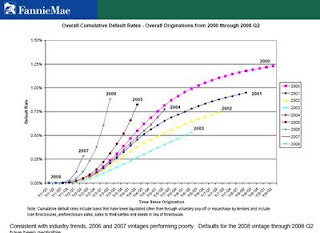
What this chart shows is the cumulative loss on loans versus the time the loan was originated. It’s a sort-of-generalisation of the securitisation cum-loss charts with which I am so familiar.
This chart contains several trends that are representative of the whole mortgage industry. The 2007 pools are radically worse than the 2006 pools which are in turn radically worse than the 2005 pool. The 2004 pool is OK but turning a little sour at the edge…
I have a pet theory as to why the 2007 pools are so much worse than 2006. Its not that the lending was any more stupid in 2007 or that property prices had gone one step too far. It was that there were many bad loans made in all years after 2002 however the bad loans didn’t default – they were refinanced. They all thus wound up in the later pools and hence the later pools preferentially contained the bad loans. They are thus awful.
Anyway Fannie Mae doesn’t give us this data in tabular form – but here is my simple model.
Data:
The 2006 pool is currently behaving about 3 times worse than the 2000 pool.
The 2007 pool is currently behaving about 6 times worse than the 2000 pool
The rate of deterioration of prime delinquency is increasing
Fannie Mae took credit risk on 615 billion of mortgages in 2006 and 746 billion of mortgages in 2007. We do not know how many of those mortgages are still outstanding – but total mortgages outstanding are a bit over 3 trillion.
The baseline 2005 pool wound up with cumulative loss of 1.25% plus a trivial amount in the out-years.
Assumptions
That the outstanding mortgages from 2006 are 450 billion reflecting some repayment to date. (This is a good educated guess – if Fannie publishes the data somewhere I have no memory of it…)
That the outstanding mortgages from 2007 are 650 billion reflecting some repayment to date (another educated guess…)
That the relative performance of the 2006 and 2007 pool vis the 2000 pool remains the same – which means if it starts 3 times worse it ends 3 times worse.
Calculations
The 450 billion outstanding from 2006 will wind up a further 2 times 1.25% worse than the baseline 2000 year. That is 3 percent of 450 billion – say 15 billion.
The 650 billion outstanding from the 2007 year will wind up a further 5*1.25 worse than the baseline 2000 year. That is 7.5% of 650 billion – or 49 billion.
That totals 64 billion.
Some notes on the model
There will be a few losses from 2005 and other years – but they are small.
The numbers could be MUCH worse than this – because as I have noted the rate of deterioration is accelerating – which tends to indicate much worse.
They could also be worse than this if the mortgage insurers who are the frontline protection on the high LTV loans fail. [Mortgage insurance is already built into the base line losses.]
There are also a few things that Fannie is currently doing in loan modifications that look like loss deferral and that could further mean my numbers are conservative.
Against this, losses could be better than these calculations because there could be a pig-through-the-python effect in the conventional mortgage market just as I believe there has been in subprime. [Indeed there is some evidence that the 2007 pool is so bad precisely because a lot of bad loans did one last refinance into Fannie Mae. That is proof that Fannie’s management is incompetent. But it would cause a pig-in-python effect and mean my loss estimate for the 2007 pool is overstated.]
But – in the absence of a better model based on better data (something I think the world cannot provide us at the moment) I suspect that there is about 64 billion in excess losses coming through at Fannie Mae.
That is enough to render Fannie Mae insolvent. Indeed it is nearly enough to render Fannie Mae as “profoundly insolvent”. Not quite – but close.
I am not buying the stock here. If given a guess I would be on the short side – but I can find plenty more to short that I think is easier and more likely to be right than this.
Personal conclusion
My a-priori expectation was that Fannie was going to be better than that. If you had put a gun at my head and asked me would I prefer be long or short I would have said long.
Now I would say short.
I have no position and it is likely to stay that way. But for once I do not think the shorts are grotesquely overstating their case.
To my readers
Thank you for coming on this intellectual ride. Its caused me some grief as I have promised you a model which I could barely deliver. And it scares me to pretend I know more about the future than I do about the past and present.
But I have learnt something – and I hope you have too.
To the several people out there (including friends) who just knew in their gut what the answer would be - all I can say is your gut is more knowing than mine...
John